CoreDNS monitoring with stunnel
This article can be seen as a follow up to Monitor with SSH and Prometheus, but in a different, hopefully, more simple way.1
Now I want to monitor CoreDNS running as a DNS to HTTPS proxy in my home network.
In one word: stunnel. (I had to upgrade Raspbian to Debian Testing to get an up to date stunnel though.)
I’ve setup a simple TLS tunnel with a pre-shared-key between my prometheus server and the NATted Raspberry Pi running in my homenetwork.
The client config on the server; % more /etc/stunnel/coredns-monitor.conf:
pid = /var/run/stunnel4/coredns-monitor.pid

[PSK coredns]
client = yes
accept = 1149
connect = <my IP addr>:1149
ciphers = PSK
PSKsecrets = /etc/stunnel/psk.txt
And on the client, the server config:
pid = /var/run/stunnel4/coredns-monitor.pid

[PSK coredns]
accept = 1149
connect = 9153
PSKsecrets = /etc/stunnel/psk.txt
CoreDNS has been started with exporting the montioring, which by default happens on port 9153.
On my server a curl localhost:1149/metrics now returns the metrics.
On the Prometheus side, this look like any other scraped job:
- job_name: coredns
  static_configs:
    - targets: ['localhost:1149']
  relabel_configs:
    - source_labels: ['__address__']
      target_label: 'instance'
      regex: '.+(:1149)'
      replacement: 'pi'
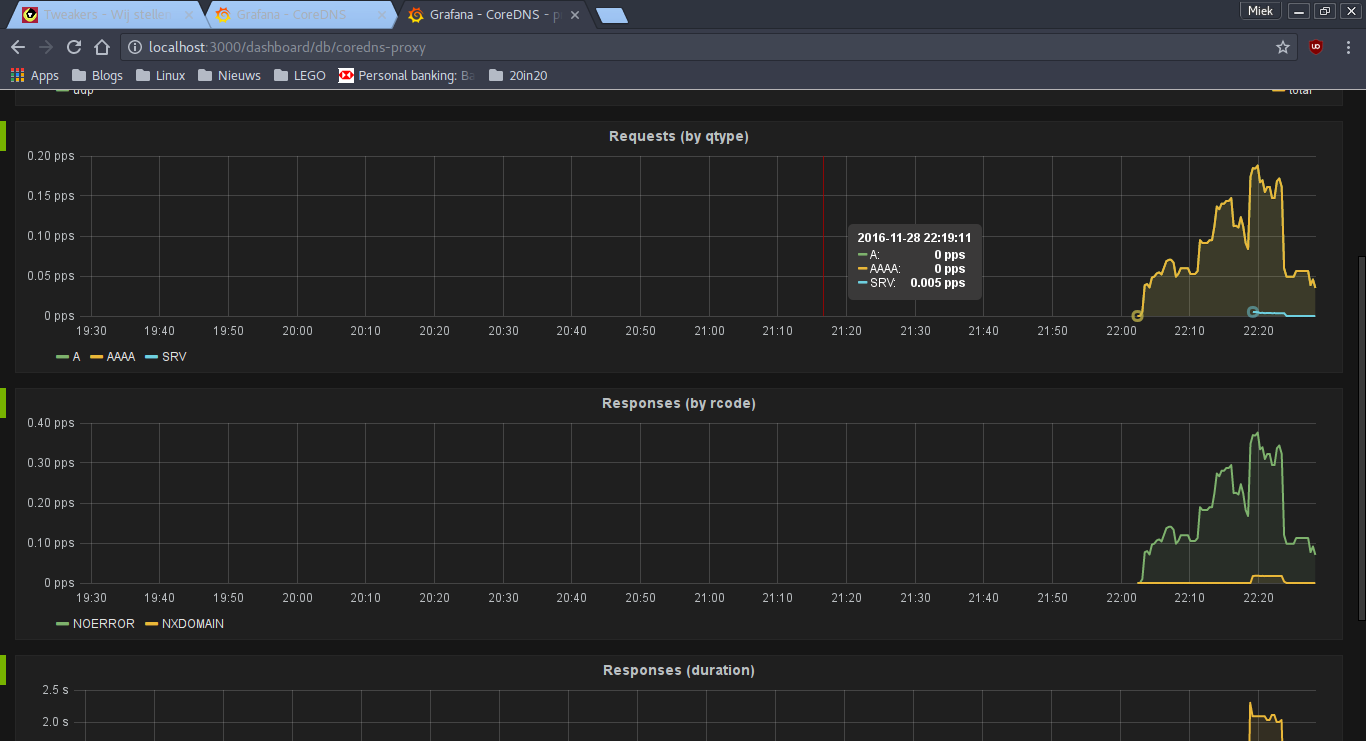
Marvel it this colorful dashboard, but again, I’m struggling to get to one qps:
-
I never go those ssh-tunnels to start reliably on boot. ↩︎