Monitoring with SSH and Prometheus
I just wanted to see some qps metrics from BIND9.
This is a bit of hand wavey post on how to set up remote monitoring with Prometheus, Grafana and SSH tunnels.
Initially I just wanted to monitor BIND9 because it actually exports some reasonable metrics, that can be made usable with bind_exporter. But of course BIND is BIND so this is different in BIND 9.10 which is what I have on my server…. sigh. @jpmens also has some interesting tidbits about this BIND9 feature.
The idea to use SSH to remotely scrape hosts came from here. The rest of this post is about how I did not get all BIND9 metrics working, but got something decent running in the end:
Configuring BIND and bind_exporter⌗
Get and install “bind_exporter” and configure BIND to actually export something, I’m using the heuristic “monitoring-port = 9100 + service-port”, in your BIND9 config:
statistics-channels {
   inet * port 9154 allow { 127.0.0.1; }; };
Add a service file (dealing with systemd here) to start bind_exporter so we launch it together
with named: /etc/systemd/system/bind_exporter.service:
[Unit]
Description=BIND Prometheus Exporter
After=bind9.service

[Service]
ExecStart=/opt/bin/bind_exporter -bind.pid-file=/var/run/named/named.pid \
    -bind.statsuri=http://localhost:9154 \
    -web.listen-address=localhost:9153

[Install]
WantedBy=multi-user.target
Check if stuff works: curl localhost:9154 should result in some hideous XML and
curl localhost:9153/metrics, should result in, ahhh, sane Prometheus metrics.
Scraping with SSH⌗
Ubuntu 16.10 comes with Prometheus and Grafana (note this font-awesome bug in the current Ubuntu one) in the repos. I just installed those, and follow a guide to set these up. The only thing here that I want to mention is using SSH port forwarding to remote scrape targets.
We are going to scrape a lot of localhosts, with some relabeling magic this becomes more readable in Prometheus. (It’s a bit verbose, but I forgot and can’t quickly find how to make this more DRY.)
  - job_name: node
    target_groups:
      - targets: ['localhost:9100', 'localhost:9300']
    relabel_configs:
      - source_labels: ['__address__']
        target_label: 'instance'
        regex: '.+(:93.+)'
        replacement: 'linode'
      - source_labels: ['__address__']
        target_label: 'instance'
        regex: '.+(:91.+)'
        replacement: 'x64'
Now to setup SSH tunnels you’ll need a user that can’t do much, see
restricting access for a user
only used for tunneling. Add an monitor user all systems:
sudo adduser monitor --gecos "Monitoring Tunnel" --shell /bin/false
Become this user (% sudo -sH -u monitor /bin/bash) and configure SSH keys and test the
connection to get the The authenticity of host ... prompt out of the way.
Use systemd
magic
and write a service file that starts the tunnels. In the end this took most of the time to get
right. I’ve settled on a little script such as: /opt/bin/autossh-9100:
#!/bin/bash
autossh="/usr/bin/autossh -f -N -L"
host="$1"

# extract port number from $0
exe=$(basename $0)
port=${exe##autossh\-}

case "${host}" in
    linode)
        remote=$((port + 200))
    ;;
    voordeur)
        remote=$((port + 400))
    ;;
esac
$autossh ${remote}:localhost:${port} \
    monitor@${host}.atoom.net
And then call that from systemd, with service template files that reference the host
monitor-tunnel-9100@.service:
[Unit]
Description=Monitor Tunnel Setup %i
After=prometheus.service

[Service]
User=monitor
ExecStart=/opt/bin/autossh-9100 %i
Restart=on-failure

[Install]
WantedBy=multi-user.target
Which you can then symlink and call: monitor-tunnel-9100@linode.service. If you’re wondering why
you just can’t start a shell script with all tunnels: each of the autossh forks and manages its
own tunnel: multiple forking processes is not something systemd can deal with… Hence this setup.
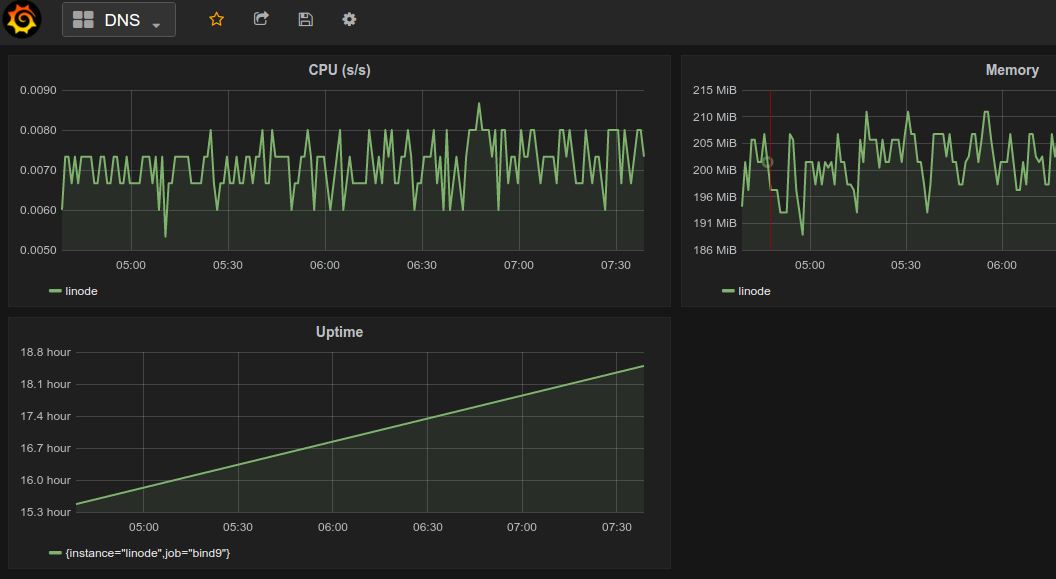
Next Steps⌗
Next is “just” configuring Prometheus and Grafana to scrape and display the correct metrics.
Alerting is something that needs to happen, but I haven’t touched in this post. And I need to fix
bind_exporter to get me some more metrics.